


If you have been following along with our discussion on key point indicators (KPIs) you already know how important these small metrics are to helping you stay on top of how your business is performing over time.
If you haven’t had a chance to check out the first two articles in this series, you may want to give KPIs: Tiny Metrics With Huge Impact and Ten Solid Project KPIs To Start Tracking Today a read as well. The first article in the series dives into what KPIs are and explains all of the different data points that could be useful KPIs to measure, and why. The second article in the series goes a bit deeper into what makes an effective KPI and gives you a head start on setting up your own tracking and analysis system with ten of the best KPIs for tracking business health, team performance, and customer satisfaction for small businesses and agencies.
With this final article in our intro to KPIs series, we will be wrapping up our discussion on KPI tracking and analysis with a look at the practicalities of monitoring, measuring, and reporting an array of small metrics in an organized fashion. In other words, you know why you need to track these details, you know which details are most important to track, and now you need to figure out how to make sure that you can actually access and use the data you have collected.
But first, let’s do a quick summary of everything we have covered so far.

KPIs: The Basics
KPIs are measurable data points or values that help a business, agency, or team leader track different aspects of a task, project, or policy. Individual KPIs provide insight into a specific factor like how long a particular task takes to complete, or how many days a particular team member is absent from work. This is certainly useful knowledge to have but its value is limited on its own. To get the most from your KPI monitoring or tracking efforts you will need to evaluate each KPI both separately and in the context of many others.

What Makes A KPI Tracking Program Effective?
What determines whether your KPI tracking program will deliver the actionable insights that you can use to improve your business health? There is no right or wrong answer to that question. The effectiveness of any KPI tracking system will depend on several factors. For starters, you will need to take the time to hammer out exactly what sort of information you believe would be most valuable to you in running your business or making critical staffing or policy decisions.
For small businesses, design agencies, and creative teams the KPIs you choose should be based on the type of service you are providing, the nature of how your team works to complete tasks and projects, and what your clients expect from the business will all have a big impact on the KPIs that you choose. For example, if you have a small business that produces handmade soaps and your team works on-site creating the soaps, and packaging and shipping orders, you would likely use standard productivity KPIs that track how many soaps your team was capable of producing per hour, and what percentage of those soap bars were high-quality and how many were flawed or damaged and had to be scrapped. You might even assign a system that keeps track of individual team member’s productivity, and their rate of wasted product, so that you would be aware of a developing problem.
For design agencies or businesses with several different teams delivering an array of services, you are likely to need a KPI tracking program that tracks different factors relevant to each team, and the way that they work. In these cases, it can be helpful to break down the core work done by each team into distinct projects, and then break those projects down into distinct tasks. This will allow you to create highly targeted KPIs that can then be grouped with other KPIs from the same team, same client, or same service category to provide you with both a big-picture view of team performance, project costs, and individual team member performance.
As a general rule of thumb, your KPI tracking program should provide insight into the following core areas of your business operations.

Financial Health
This one goes without saying. Most business owners already have their business profitability at the top of their list of KPIs. Our suggestion is that you look beyond the profit and loss statement, and develop KPIs that track overall revenue, and profits, as well as the dollar amount that you are spending on the various elements that go into creating your product or service. Tracking KPIs at this granular range will ensure that when you see your profits take an alarming dip you will have the information you need to quickly identify the most likely source of the decline.
Productivity
Productivity is one of the broadest categories of elements that you will measure. This covers how much your team and its individual team members are able to produce, and the quality of their work. You may have KPIs that measure how many projects are completed in a specific period, how many projects are completed on time, and how many seem to consistently require extra time to complete. Looking at these KPIs at a team level as well as at an individual level is going to help you create more effective policies, assign work in the most efficient manner, and set client expectations regarding the amount of time a project will require and the overall cost.
Customer Satisfaction
Knowing how your customers feel about your business and taking concrete steps to make sure that your customers have a positive experience is critical to the success of your business. Customer satisfaction is generally gathered from direct surveys and reviews. However, you can also gauge your customer’s happiness by measuring the number of customers who return to make repeat purchases, as well as the number of visitors who take the first step in engagement with your business but fail to continue.
Team Satisfaction
Finally, you don’t want to overlook the satisfaction of your team. A happy team is a motivated and productive team. You can stay on top of employee satisfaction with regular polls, or questionnaires. You can also make indirect associations by keeping an eye on the rate of employee absences and tardies, or a drop in productivity across the entire team. An uptick in absences and late starts, or a slower pace could be an early indicator that your team morale needs a boost.

How To Track & Report KPIs
Once you have determined which KPIs are going to be the most useful for your team and your business, your next step will be determining the best way to track and report your KPIs in a way that will make it easy for you to extract the information you need from them.
There are several methods commonly used to track KPI data and the method you choose will depend on how complex your business model is, how many KPIs you will be tracking, and what you plan to do with your KPI reports. For instance, are your KPI reports going to be used solely for assisting you and your administrators in making operational decisions, or do you anticipate publishing KPI reports for public transparency or sharing KPI reports with shareholders?
Here are some additional factors that could play a role in determining what type of KPI tracking method will work best for you.
Source Of KPI Data
Consider where you expect to gather your KPIs from. You could generate internal data through an automated tracking system, you may also use external sources of KPI data like feedback forms, surveys, and invoices. If you will be tracking KPIs through a time tracking or task management app like Daybean, then chances are that the platform will offer some level of reporting built into their service. For example, Daybeam allows users to generate customized reports with their tracked KPI data organized in a way that makes sense to their business.
Format Of KPI Data
You will also need to consider what format you would prefer to view reports in. There are a few different options when it comes to creating a report for analysis with some types of data best reported in words, and some better suited to numeric tables or graphs.
Let’s take a look at the most common options.

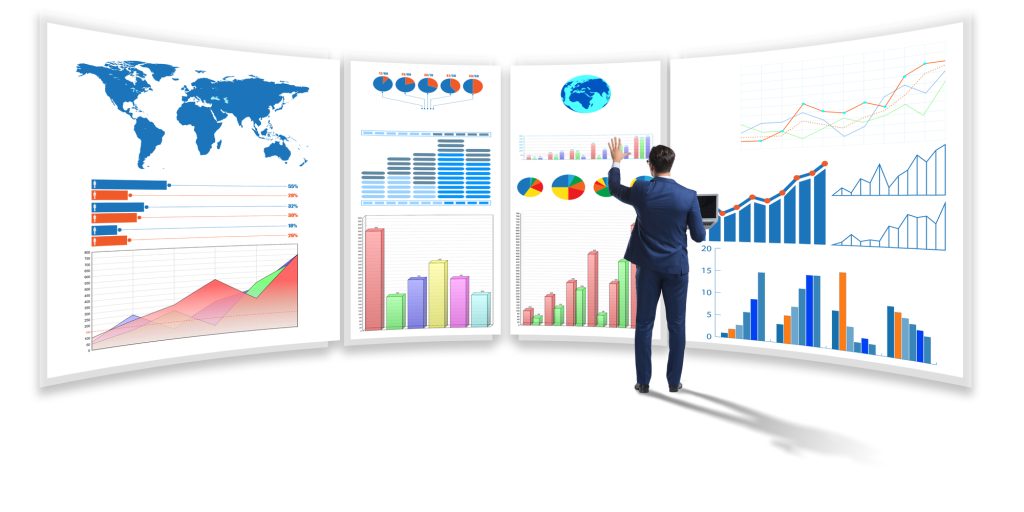
Visualization
Data visualization transforms KPI data points into easy-to-read visual representations like bar charts, scatter plots, pie charts, graphs, maps, diagrams, and other visual aids. KPI data visualizations can make it easy to spot trends and patterns quickly so you can make instant corrections. They are also great for sharing data with your shareholders and team. On the other hand, accuracy and attention to detail are crucial when using data visualizations as it can be all too easy to create misleading visuals that don’t display an accurate rendering of the KPI results.
Exploration & Inference
With reports that focus on data exploration, the KPI data is analyzed to look for any patterns, trends, or correlations, and the results are communicated in reports using a variety of numerical and written summaries, hypotheses, theories, or questions to be answered or solved.
Data inference reports are similar to the data exploration style described above but tend to concentrate more on statistical methods. This method is well suited to creating solutions, testing hypotheses, and other more complex data analysis needs.
Frequency Of Data Updates
You will also need to think about how frequently you would like to be updated on KPI tracking results. If you are just starting out, or instituting some major changes in your business operations you will likely want to see KPI data reports on a daily or weekly basis to make sure that you are able to catch and correct any unexpected negative outcomes as quickly as possible. Established businesses with stable and proven business policies and practices and an experienced team may prefer to receive one comprehensive KPI data report once per month, quarter, or year.

KPI Tracking Tools & Methods
If you have hammered out your KPI data reporting needs you can move on to the final step, choosing the best KPI tracking & reporting tool for your needs. KPI data is generally reported in one or more of the following three ways.
Simple Spreadsheets
Simple spreadsheet software is the old-school tried and true method of tracking data. Spreadsheet software programs like Google Sheets, Microsoft Excel, Apple Numbers, and others are readily available to all with free versions as well as paid options with more advanced features. Most people have had some experience setting up and using these platforms to generate data tables, info charts, graphs, numeric formulas, calculation, and tracking functions, making them one of the easiest to use for everyone on the team. However, this easy accessibility combined with the need to enter a large amount of data manually does make this method more prone to errors. Completed spreadsheets can be stored digitally, or printed and shared with your team.
Comprehensive Reports
Comprehensive reports are generally favored in cases where you need to communicate the health of your business to shareholders, investors, or others. Reports are the most time-consuming and labor-intensive methods of KPI reporting but generally provide the most thorough detail with an explanation that outside stakeholders and customers can understand as well. These detaile-filled briefs generally feature an analysis of the KPI data results with a summary of key takeaways, valuable insights, and actionable solutions to remedy any problems revealed in the data. Comprehensive reports are usually presented in PDF, Doc, or PowerPoint-style formats.
Digital Dashboards
Digital dashboards are quickly becoming the KPI tracking, analysis, and reporting tool of choice for many small businesses and agencies. Digital dashboards can be stand-alone products or they may be connected to your automated, KPI tracking, project management, or time tracking program. The dashboard pulls in KPI tracking data as it is generated and allows users to view the latest information right from their dedicated business dashboard which makes them an excellent choice for small businesses and agencies who need to keep a close eye on task and project completion data and team productivity. Digital dashboards can be either static or interactive depending on the platform or software that you choose.
This brings our series on KPIs to a close. By now you should have all the information you need to get an excellent start on your own KPI tracking program. If you are using Daybeam to track your team’s time then you are already ahead of the curve because KPI tracking and reporting tools are built right into the platform. Check it out for yourself today!